
How to waste your time fixing the wrong things
How to waste your time fixing the wrong things
You work off data and you don't ask questions

Raw data and analytics can tell you exactly what users did, which is great… if that’s all you want to know.
But, pry into the data any further and you’ll naturally begin to ask WHY users did what they did. WHY did users drop off on this page of the flow? WHY did users take complete this form in 10 minutes when we only expected them to take 5? You ask these questions because you’re human and you know that the WHY is more important than the WHAT.
The WHAT leaves you pondering and hypothesizing about what you can or can’t do to share and understand your user’s behavior. The WHY is actionable.

It’s like watching a true crime documentary. A description of the crime reveals clues about what happened and where, who the victim was, what weapon was used, and whodunnit. That’s cool…
BUT BORING.
That’s not why you turned on CSI: Miami and it won’t keep you coming back for more. You want to know the motivation. What went down before it happened? Who started it? Explain to me how the people involved were related what the telltale signs beforehand were so that this s*#%t don’t happen to me!
The WHY gives you the complete story. The WHY is actionable.
Sometimes the data can even lead you astray.
Let’s say you’re looking at drop-off numbers for a user flow. You see tons of users quit on a specific page, so you decide to redesign it. After you ship, you’re STILL seeing people quit on the same page.
“Huh?,” you ask. “What’s going on?”.
What the data didn’t tell you is that the page before it is the one that primed your users to misinterpret the next page they failed on - the page you redesigned.
If you knew why users were failing in the first place, you wouldn’t have wasted time experimenting with the wrong redesign.

When you look at analytics, don’t assume you know the WHY behind what it shows you.
Meet with users often to figure out what is contributing to their behavior.
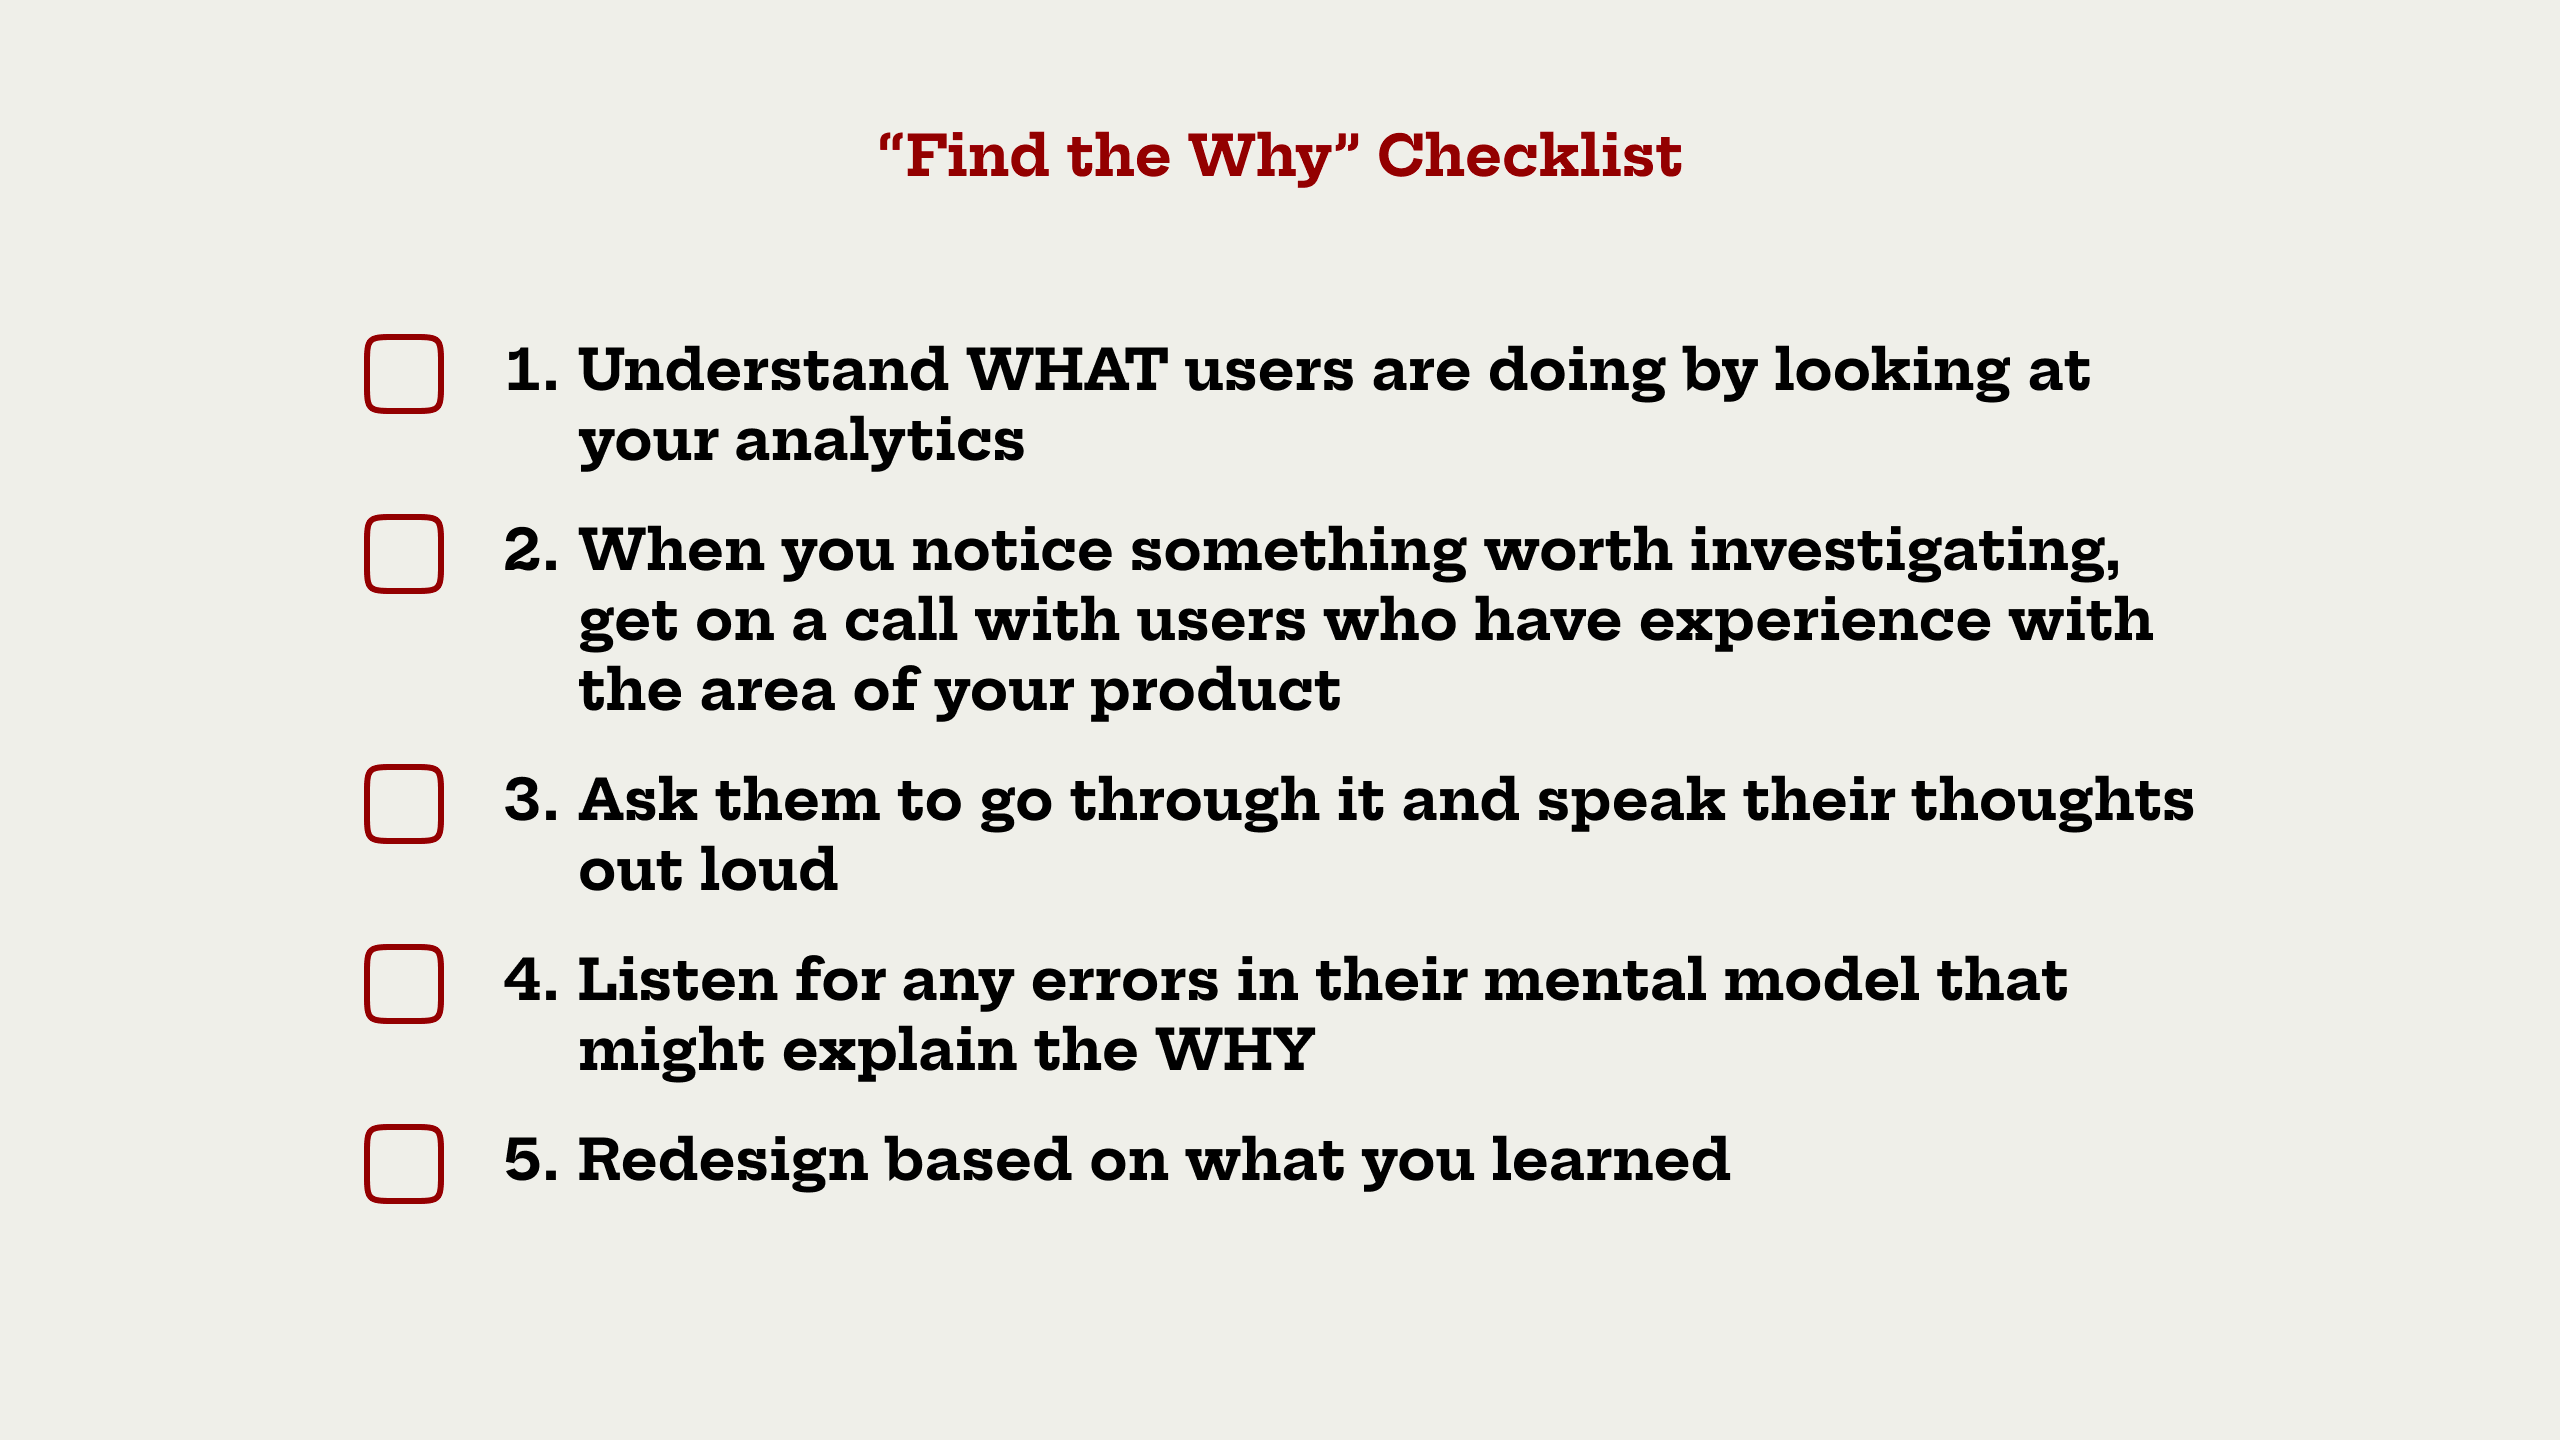
Here’s a step-by-step checklist you can use in the future when want to improve areas of you product experience: